Statistical Data on Shimonoseki 1
Population
Change in population and the number of households
| Year | Area (km²) |
The number of households | Population | Population density (per 1km²) |
||
|---|---|---|---|---|---|---|
| Total | Male | Female | ||||
| 1955 | 714.40 | 64,340 | 308,799 | 151,441 | 157,358 | 432.2 |
| 1960 | 714.39 | 73,299 | 317,029 | 153,794 | 163,235 | 443.8 |
| 1965 | 715.03 | 79,847 | 317,146 | 151,400 | 165,746 | 443.5 |
| 1970 | 715.54 | 87,697 | 315,603 | 148,940 | 166,663 | 441.1 |
| 1975 | 717.81 | 95,481 | 322,300 | 152,837 | 169,463 | 449.0 |
| 1980 | 718.41 | 102,531 | 325,478 | 154,046 | 171,432 | 453.1 |
| 1985 | 718.69 | 105,886 | 324,585 | 152,908 | 171,677 | 451.6 |
| 1990 | 715.30 | 109,846 | 315,643 | 147,542 | 168,101 | 441.3 |
| 1995 | 715.60 | 115,193 | 310,717 | 145,503 | 165,214 | 434.2 |
| 2000 | 715.79 | 117,744 | 301,097 | 140,890 | 160,207 | 420.6 |
| 2005 | 715.89 | 117,360 | 290,693 | 134,719 | 155,974 | 406.1 |
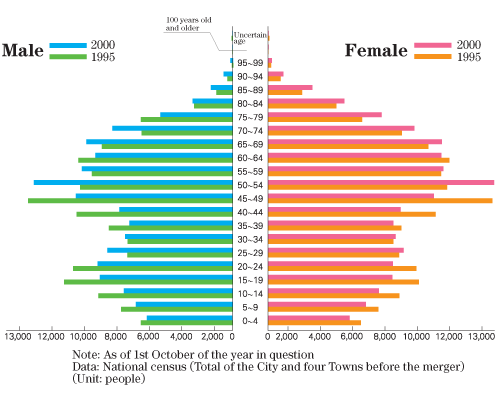
Note: As of 1st October of the year in question
Data: Area investigation by municipality, National census (Total of the City and four Towns before the merger)
Population by gender and age (five year old scale)